Hybrid
Portfolio optimization against single-asset optimization
Question this page answers How much value is left on the table by optimizing assets one at a time instead of as a portfolio?

Renewable assets are mostly still managed one at a time. Each plant has its own forecast, its own nomination, its own settlement line and, in many organisations, its own asset manager judged on that plant’s numbers. The portfolio exists in the annual report and nowhere in the operating decisions.
Fleet-level dispatch and curtailment analysis across groups of renewable assets keeps showing the same pattern: the assets rarely hit their limits at the same moment. A grid constraint bites on one site while another has headroom. One plant’s forecast runs high in an hour when its neighbour’s runs low. A contractual profile obligation pinches on one asset in a block where the others sit comfortably inside their bands. Because the constraints do not coincide, the portfolio’s exposure to a bad hour is smaller than the sum of each asset’s exposure to that hour.
That is the whole mechanism.
Where the netting comes from
Imbalance settlement charges the difference between what a position nominated and what it delivered. Two assets settled separately pay for two errors. The same two assets settled as one position pay for the net of the two, and whenever the errors have opposite signs the net is smaller than either.
How much smaller depends on the correlation between the assets’ errors, and only on that. Ten wind farms on the same ridge, fed by the same front, over-deliver and under-deliver together, and netting between them is weak. A wind farm and a PV plant have errors driven by different physics; a northern wind site and a southern one see fronts at different times. Their errors are weakly correlated or opposed, and netting between them is strong.
This is why asset count on its own tells you nothing. A large fleet of near-identical assets nets poorly. A small mixed fleet can net very well. The portfolio’s value as a portfolio lives in its correlation structure, which an owner can measure from settlement history and, over time, shape through acquisition.
Decisions that look wrong for one asset
Once settlement is counted at portfolio level, some decisions that are plainly suboptimal for one asset become the value-maximizing choice for the whole.
Consider curtailment. Seen from plant A alone, curtailing it in an hour with a positive price gives up revenue and is a mistake. Seen from the portfolio, the same curtailment might reduce a net long position in an hour where the balancing price has fallen far below day-ahead, so that surplus energy would otherwise have settled at the low price. Plant A’s own result gets worse. The portfolio’s settlement improves by more than plant A lost.
Anyone managing plant A in isolation has no way to see this trade and no incentive to make it; a manager whose bonus follows plant A’s own realized value will fight it.
A simulated illustration
The scenario below is invented for illustration. It is a simulation with stated assumptions and describes no real portfolio’s operation, nomination or dispatch.
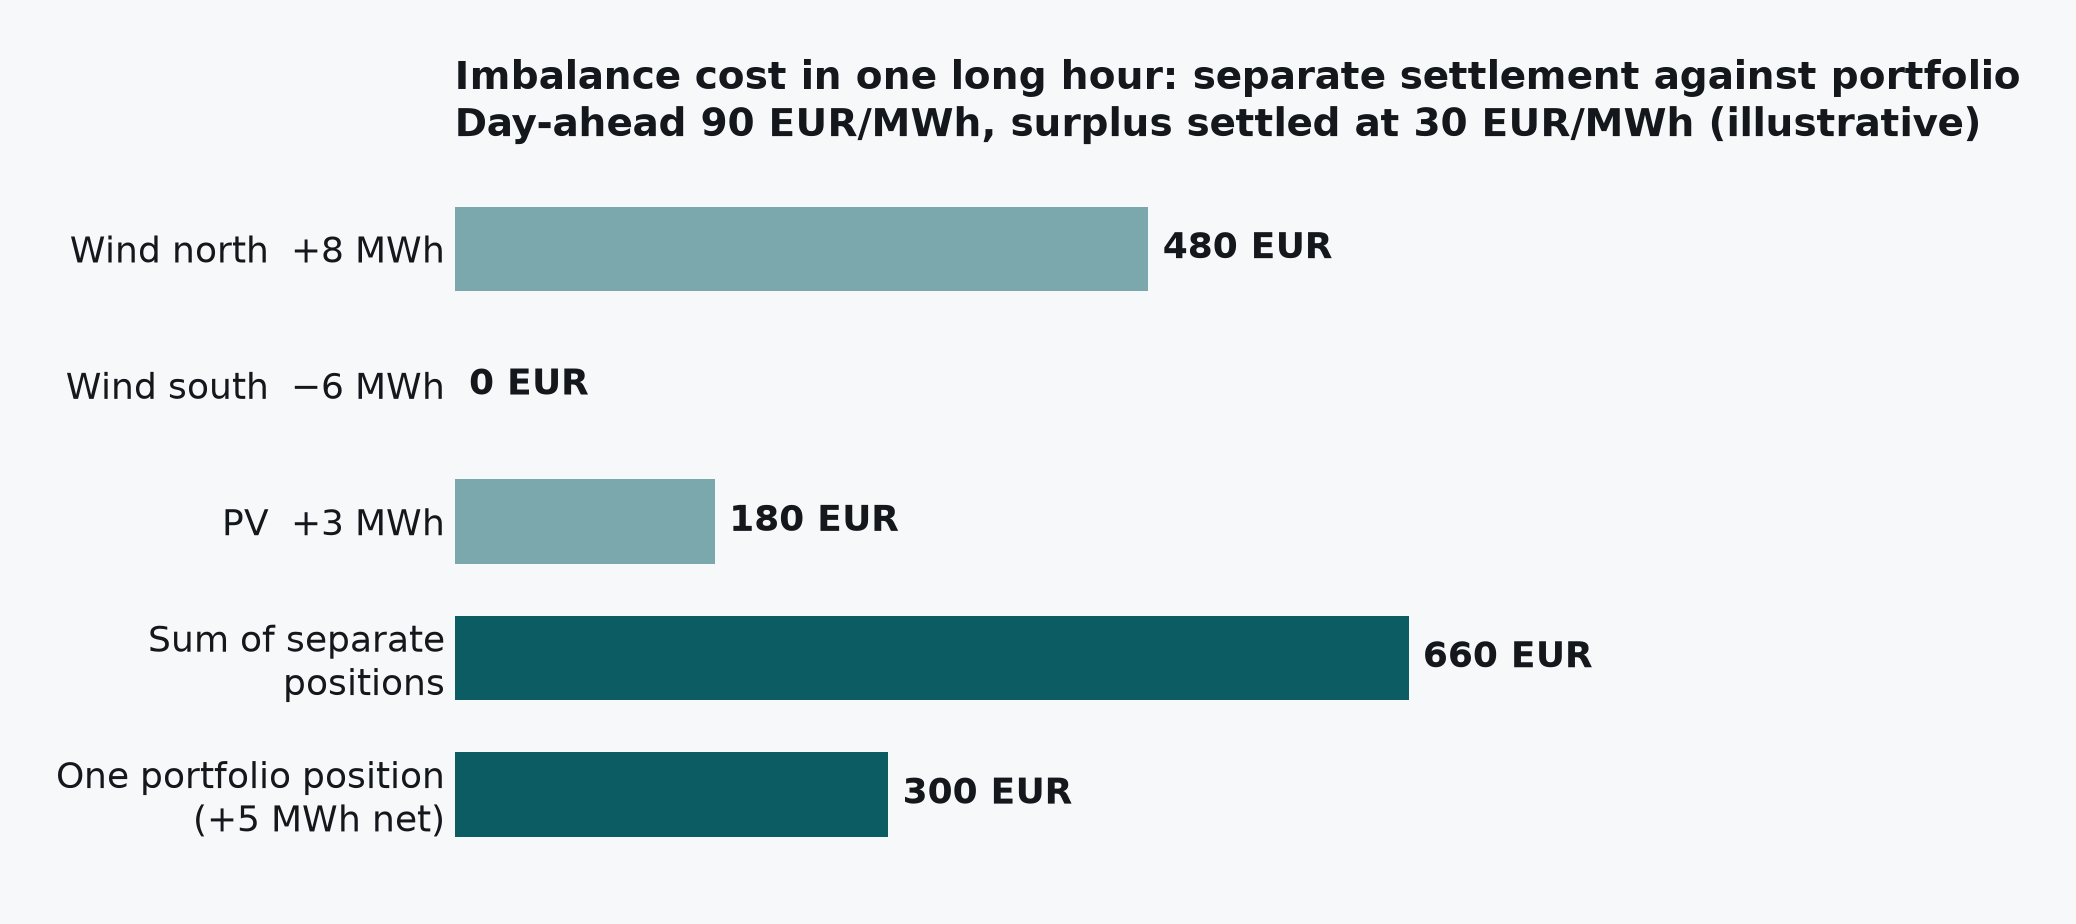
Assume three assets and a single settlement hour in which the system as a whole is long. The day-ahead price is 90 EUR/MWh. Settlement is dual-price, a structure still used in several European zones: a position that worsens the system imbalance (a surplus, in a long hour) is settled at the balancing price of 30 EUR/MWh, while a position that helps (a shortfall) is settled at the day-ahead price and costs nothing.
| Asset | Nominated | Delivered | Error | Settled alone |
|---|---|---|---|---|
| Wind north | 40 MWh | 48 MWh | +8 MWh | surplus 8 MWh sold at 30 instead of 90: cost 480 EUR |
| Wind south | 35 MWh | 29 MWh | −6 MWh | shortfall settled at day-ahead: cost 0 EUR |
| PV | 20 MWh | 23 MWh | +3 MWh | surplus 3 MWh at 30 instead of 90: cost 180 EUR |
| Sum of separate positions | cost 660 EUR |
Settled as one portfolio position, the errors net to +5 MWh, sold at 30 instead of 90: a cost of 300 EUR. The portfolio pays 360 EUR less than the three assets paid separately, in one hour, with no change to any forecast and no change to what any plant produced. Wind south’s 6 MWh shortfall absorbed 6 MWh of the other plants’ surplus before settlement ever saw it.
In zones with single-price settlement the arithmetic inside one interval is linear and the pure settlement saving is smaller. The benefit then arrives through other doors: lower gross imbalance volumes, lower fees and collateral, and above all the ability to nominate less conservatively once the portfolio’s combined error is smaller than any single asset’s. Over a month of hours, in either structure, the separate-asset total is persistently worse than the portfolio total, with the gap sized by how often the errors offset. That gap is the netting benefit, and it is captured or forfeited depending entirely on whether settlement and nomination are organised at portfolio level.
The self-test
There is a simple way to see how much of this a portfolio captures today, using numbers most owners already have.
Compute realized value per MWh for the whole portfolio: net financial result after every channel and cost, divided by total production.
Then compute the same metric for each asset on its own, as if it were settled in isolation, and take the volume-weighted average across the assets.
If the two figures are the same, the portfolio is being run as a collection of assets and no netting benefit is being captured. If the portfolio figure sits persistently above the weighted average, that gap is the benefit already realised, and its size tells you what the correlation structure is worth. Many owners who run this comparison for the first time find the two numbers identical, because nothing in their setup ever settles the assets together.
Practical implications
Measure the correlation of forecast errors between assets from settlement history before assuming any netting exists. A homogeneous fleet may have very little.
Move nomination and settlement to portfolio level where the market and the contracts allow it. The benefit only exists for positions that are actually settled together.
Align incentives with the portfolio figure. A team judged on single-asset results will, rationally, resist the decisions that improve the portfolio.
Related reading
- Portfolio-Level vs Single-Asset Optimization — the general case for this simulation
- BESS Revenue Stacking Inside a Portfolio — the same netting logic applied inside a single asset’s own dispatch
- What Realized Value per MWh Actually Measures — the metric the netting benefit ultimately shows up in
Which of your assets is currently being managed to make its own number look right at the portfolio’s expense?