Solar
Capture price against realized value per MWh for PV
Question this page answers Why does a PV plant with a good capture price still underperform on realized value per MWh?

A PV owner looking at declining revenue per MWh is usually looking at two separate problems that have been added together in one number. One of them is happening to every solar plant in the market at the same time, and nothing can be done about it from the control room. The other is specific to the portfolio, and it is the part where operating decisions change the outcome. Most reporting does not separate them, so most owners are either blaming their operations for a market phenomenon or excusing their operations with one.
Capture price: the market-wide part
Capture price is the production-weighted average of the day-ahead price. For PV it is a statement about what the market pays for energy delivered in the middle of the day, in the months when the sun is high.
Analysis of solar merit-order effects shows a pattern now visible across most European markets with significant PV. As aggregate solar output approaches a threshold share of midday demand, the solar capture price stops declining gently and starts falling steeply. The mechanism is straightforward. Solar plants all produce in the same hours. Once there are enough of them, those are the hours where the market is already long on renewables, conventional generation has been pushed to its floor, and the marginal price is set by whichever unit is willing to pay to stay on, or by the export limit, or by nothing at all. A large fraction of each plant’s annual output lands in precisely those hours, and every additional gigawatt of solar deepens the trough for all of it.
The result is that the same nameplate capacity, with the same irradiance and availability, is worth structurally less at high solar penetration than it was a few years earlier. A plant that did nothing different between one year and the next can see its capture price fall materially, and so can one that improved its availability and forecasting.
The compression is a market-wide condition. It cannot be dispatched around, because there is no hour in the day the plant could move its production to. It can be planned around, through contract structure, co-located storage and the choice of what to build next.
Realized value: the portfolio-specific part
Realized value per MWh starts from the same day-ahead sales as capture price and keeps counting: imbalance costs from forecast errors, intraday results, the effect of the contract stack, curtailment decisions, fees. It is the net result of the whole chain, divided by production.
The gap between capture price and realized value is where portfolios differ from one another. Two PV portfolios in the same market face the same compression and have close to the same capture price. One of them forecasts its midday output well, nominates with the balancing spread in view, curtails when the price falls below its contract floor, and settles its assets as one position. The other does none of that. Their capture prices are nearly identical. Their realized values are not.
Working with renewable portfolios has shown that the size of that gap varies widely between owners facing the same market, which is the clearest evidence that it is under operational control. Even after the compression has taken its share, portfolios differ meaningfully in how much of the remaining, reduced capture price they actually keep.
Telling the two apart
The distinction can be made with two numbers the portfolio already has.
Capture price against a market reference. Compare the portfolio’s capture price with a solar capture price index for the same bidding zone and period. If it tracks the reference down, the decline is compression and the owner is looking at a market condition. If it falls faster than the reference, something about the portfolio’s production shape or location is worse than average, which is still mostly a design question.
Capture price against realized value. Compute the difference between the portfolio’s capture price and its realized value per MWh. That gap is the operational part. If it is widening while capture price is stable relative to the reference, operations are leaking value. If it is narrowing while capture price falls with the market, operations are doing their job against a worsening backdrop, and the reporting should say so.
An illustrative example
The figures are invented to show the arithmetic. They describe no real portfolio or market.
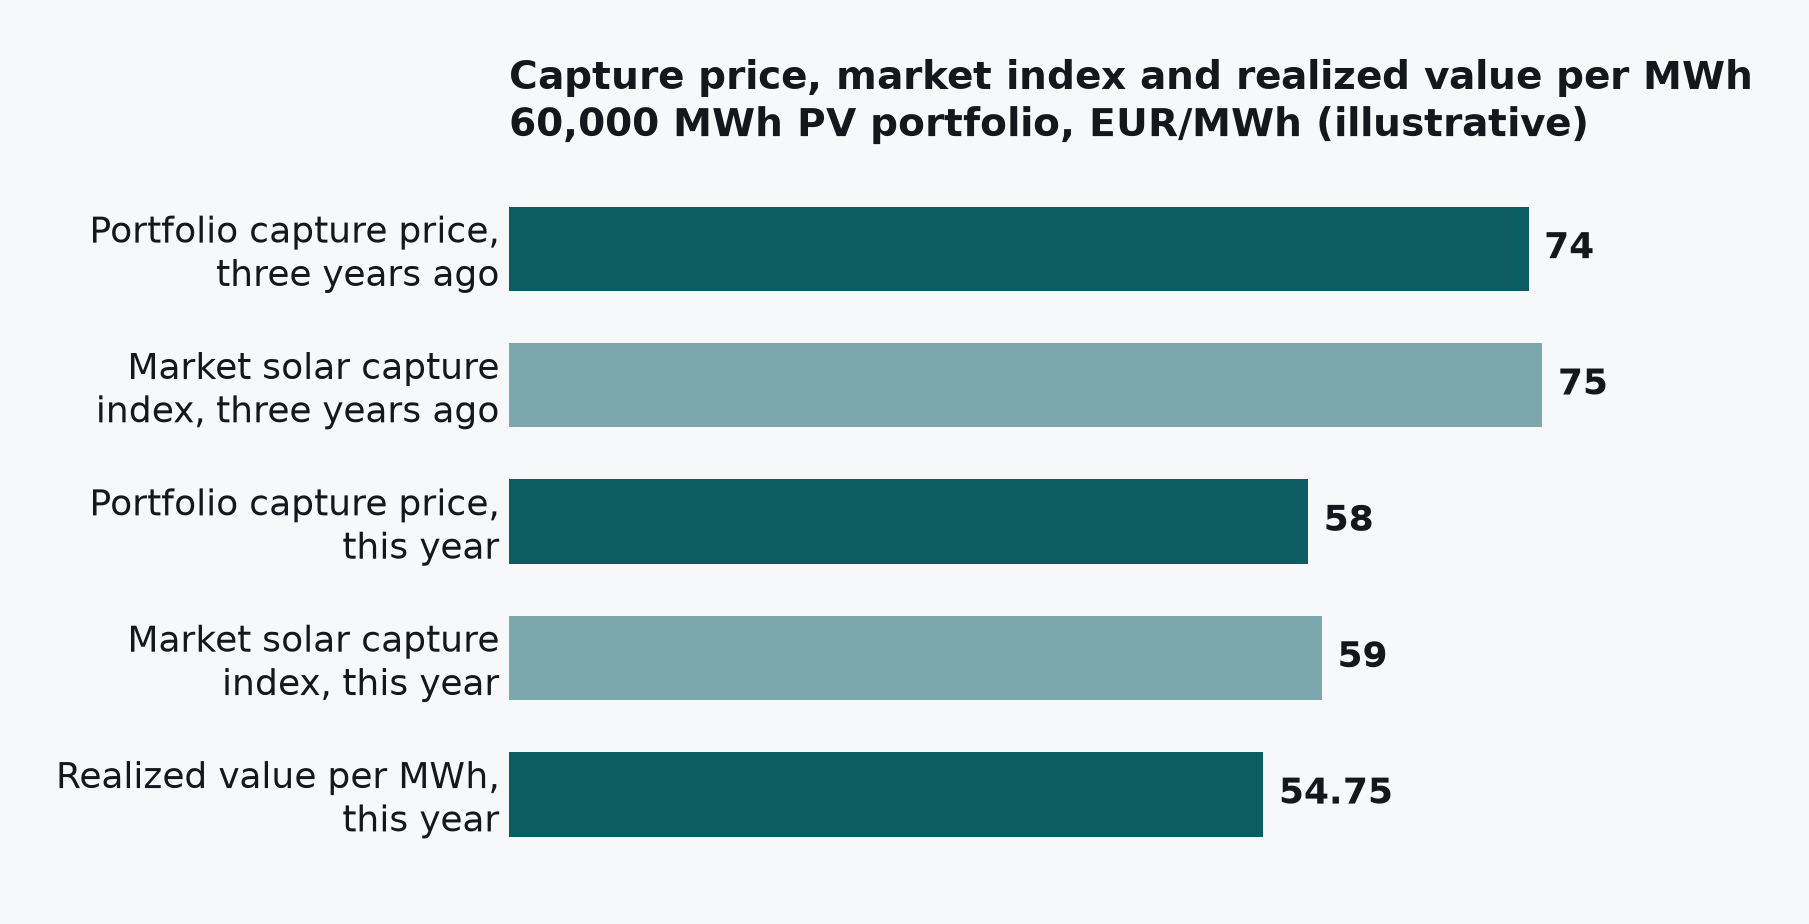
A PV portfolio produces 60,000 MWh in a year. Three years earlier its capture price was 74 EUR/MWh. This year it is 58 EUR/MWh, and the market’s solar capture index moved from 75 to 59 over the same period. The 16 EUR/MWh decline is compression; the portfolio has tracked the market almost exactly.
This year’s channels below capture price:
| Channel | Amount |
|---|---|
| Day-ahead sales at 58 EUR/MWh | +3,480,000 EUR |
| Imbalance costs | −186,000 EUR |
| Curtailment in negative-price hours, net effect on settlement | +24,000 EUR |
| Intraday repositioning | +9,000 EUR |
| Fees and charges | −42,000 EUR |
| Net result | 3,285,000 EUR |
Realized value per MWh: 3,285,000 / 60,000 = 54.75 EUR/MWh.
The gap between capture price and realized value is 3.25 EUR/MWh, about 195,000 EUR in the year. Nothing the owner does will recover the 16 EUR/MWh of compression. A large part of the 3.25 EUR/MWh is recoverable, and on this portfolio it is a mid-six-figure line over a couple of years. The calculator at /tools/realized-value-calculator/ runs this arithmetic on your own channel figures.
Practical implications
Report capture price against a market reference and realized value against capture price as two separate lines. A single revenue-per-MWh figure hides which problem is which.
Direct operational effort at the second gap. Forecasting, nomination, curtailment logic and portfolio-level settlement all act on it. None of them act on the first.
Direct structural decisions at the first gap. Contract structure, storage and the mix of the next assets built are the levers for compression, and they belong in a different meeting from the operational review.
Related reading
- Negative Price Exposure in German Renewable Portfolios — a primary driver of the market-wide compression described above
- What Realized Value per MWh Actually Measures — the definition this page’s two gaps both roll up into
- Capture Price vs. Realized Value: The Wind Portfolio Breakdown — the same distinction from the wind side, broken down by imbalance, execution and operational cost
When your PV revenue per MWh fell last year, how much of the fall was the market, how much was the portfolio, and did anyone in the room know which was which?