Wind
Capture Price vs. Realized Value: The Wind Portfolio Breakdown
Question this page answers Why does a wind portfolio's realized value per MWh come in lower than its capture price, and where does the difference go?

Every wind portfolio manager knows their capture price. It appears in board presentations, investor reports and operational dashboards. The number feels concrete, derived from metered generation and market prices at the moment of production.
But capture price tells an incomplete story. The figure that actually determines portfolio profitability, realized value per MWh, often diverges from what the headline capture price suggests.
What capture price actually measures
Capture price is the average wholesale price during the hours an asset produces power: the sum of hourly price times hourly generation, divided by total generation. For wind, this volume-weighted average tracks the asset’s own hourly production pattern rather than a flat baseload reference.
For a 50 MW wind farm producing 150,000 MWh annually, a capture price of 85 EUR/MWh against a baseload reference of 90 EUR/MWh, a 94% capture ratio, reads as strong market alignment. This is the number that typically reaches the board.
What capture price misses
The journey from captured price to realized value passes through several sources of leakage that capture price does not reflect.
Imbalance costs are usually the largest. When actual generation deviates from nominated positions, the portfolio settles the difference at imbalance prices, which can differ substantially from day-ahead levels, particularly in volatile hours. A portfolio capturing 85 EUR/MWh but facing 3 EUR/MWh in average imbalance costs across its volume has already given up 3.5% of that price before anything else is counted.
Trading execution matters too. The timing and venue chosen to sell forecasted generation affects outcomes, and the gap between achievable and actually executed prices accumulates over thousands of decisions a year. Balancing responsibility fees, generation-allocated grid charges and the cost of running trading operations subtract further.
The figures below are invented to show the arithmetic; they describe no real portfolio.
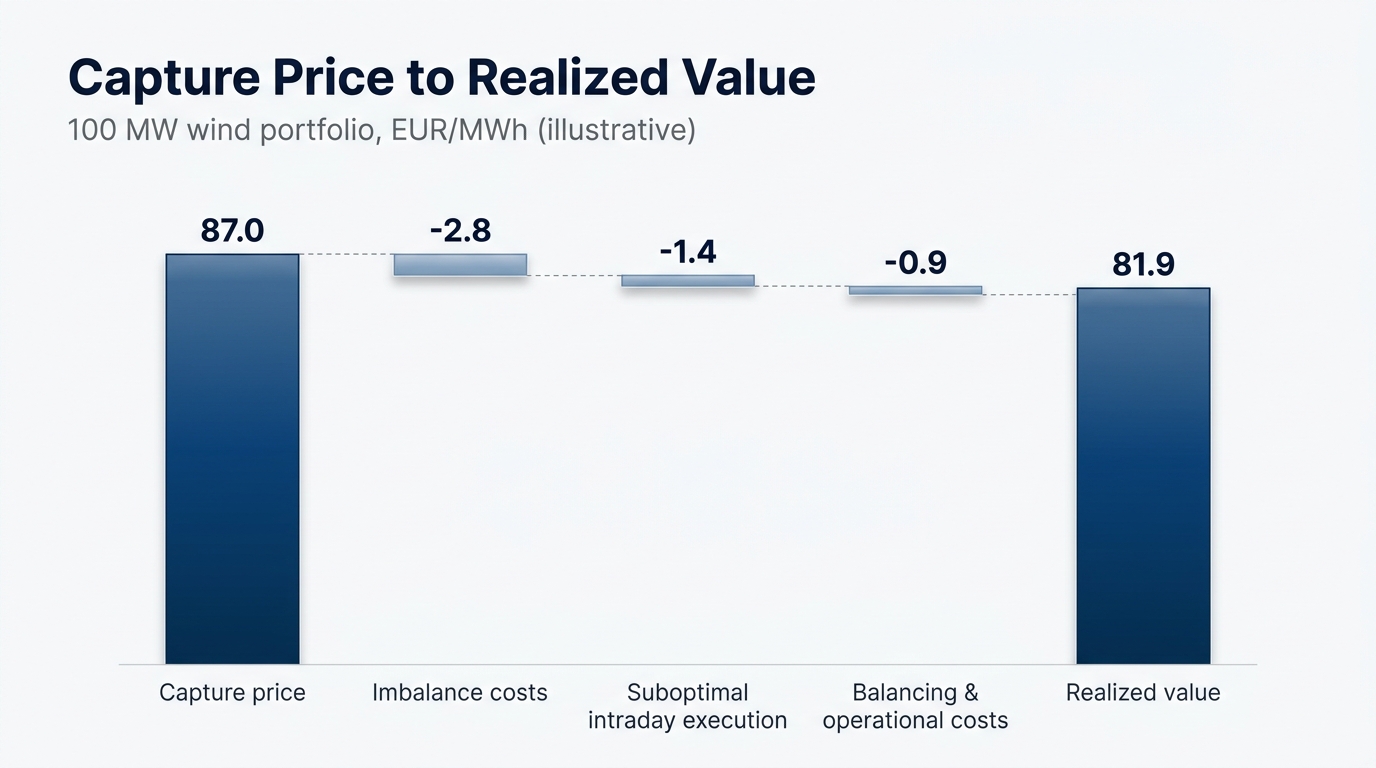
For a hypothetical 100 MW wind portfolio producing 300,000 MWh a year: a capture price of 87 EUR/MWh, minus 2.8 EUR/MWh in imbalance costs, minus 1.4 EUR/MWh in suboptimal intraday execution, minus 0.9 EUR/MWh in balancing and operational costs, lands at a realized value of 81.9 EUR/MWh. The 5.1 EUR/MWh gap, 5.9% of the capture price, is 1.53 million EUR a year that exists in the capture-price metric but never reaches the bottom line.
Why the gap varies
Not every portfolio experiences the same divergence. Forecast quality directly affects imbalance exposure: better generation predictions mean more accurate nominations and less settlement at unfavorable imbalance prices, so the value of forecast improvement converts directly into reduced leakage.
Trading infrastructure and decision speed determine execution quality. A portfolio that can respond to intraday price movements within minutes captures opportunities a slower operation misses, and this shows up in the spread between potential and actual trading outcomes rather than in capture price itself.
Portfolio composition creates natural hedging. Wind assets with imperfectly correlated forecast errors, or a wind-solar mix, can partly offset each other’s imbalance positions, so a combined portfolio often realizes better value than the sum of its parts would suggest, even though none of that shows up in the individual capture prices. Contract structure matters as well: a PPA with a fixed offtake price removes capture-price variability but can also transfer optimization value to the offtaker, so realized value ends up depending on how the contract allocates trading and balancing responsibility.
The reporting disconnect
Most portfolio reporting emphasizes capture price because it is easy to calculate and benchmark; industry publications report average capture prices by technology and region, and investors read capture ratios as a proxy for merchant exposure. Realized value per MWh takes more work: attributing trading performance, allocating balancing costs, integrating operational expense into one figure. Many organizations simply lack the systems to connect these into a coherent per-MWh number.
The result is a reporting asymmetry. Boards see capture prices that look competitive against benchmarks while actual portfolio economics lag behind. Work with large wind portfolios suggests the gap between captured and realized value commonly runs 5-8 EUR/MWh, and it rarely appears in summary presentations. Left unmeasured, it shows up instead as asset acquisitions valued on capture-price assumptions, trading operations judged without credit for their contribution to realized value, and optimization spending evaluated with no clear baseline of current leakage.
Practical implications
Closing the gap starts with treating optimization as one integrated process rather than separate functions. Portfolios need to track realized value with the same rigor applied to capture price: attributing imbalance costs to specific forecasting decisions, measuring execution against achievable benchmarks, allocating operational cost to the generation it supports.
Once measured, the sources of leakage become concrete targets rather than a vague sense that something is missing. A portfolio losing 2.5 EUR/MWh to imbalance costs has a clear case for forecast-improvement investment; execution gaps of 1.5 EUR/MWh justify a trading-infrastructure upgrade. The portfolios that consistently realize more value per MWh are not necessarily those with the best capture prices. They are the ones that minimize the distance between what the market offers during their production hours and what actually reaches the bottom line.
Related reading
- Capture Price Against Realized Value for PV — the same distinction from the solar side, where market-wide compression adds a second, non-operational gap
- What Realized Value per MWh Actually Measures — the definition this page’s waterfall rolls up into
- Portfolio vs. Single-Asset Optimization — how combining assets changes the imbalance exposure behind this gap
If your board sees capture price and your operations team manages to realized value, do the two ever get compared in the same room?